
Computational Graphs in Python
Neural Networks From Scratch lecture notes 02

Hi there!
Welcome to the third lesson of the Neural Networks from Scratch course, where we’ll build a fully functional tensor library (with automatic differentiation and all) in NumPy, while mastering the inner workings of neural networks in the process.
Let’s recap. The previous two sessions were about the mathematical prerequisites:
Now it’s time to smash the throttle and implement actual computational graphs. We’ve seen them before: for instance, consider the famous logistic regression model defined by the expression
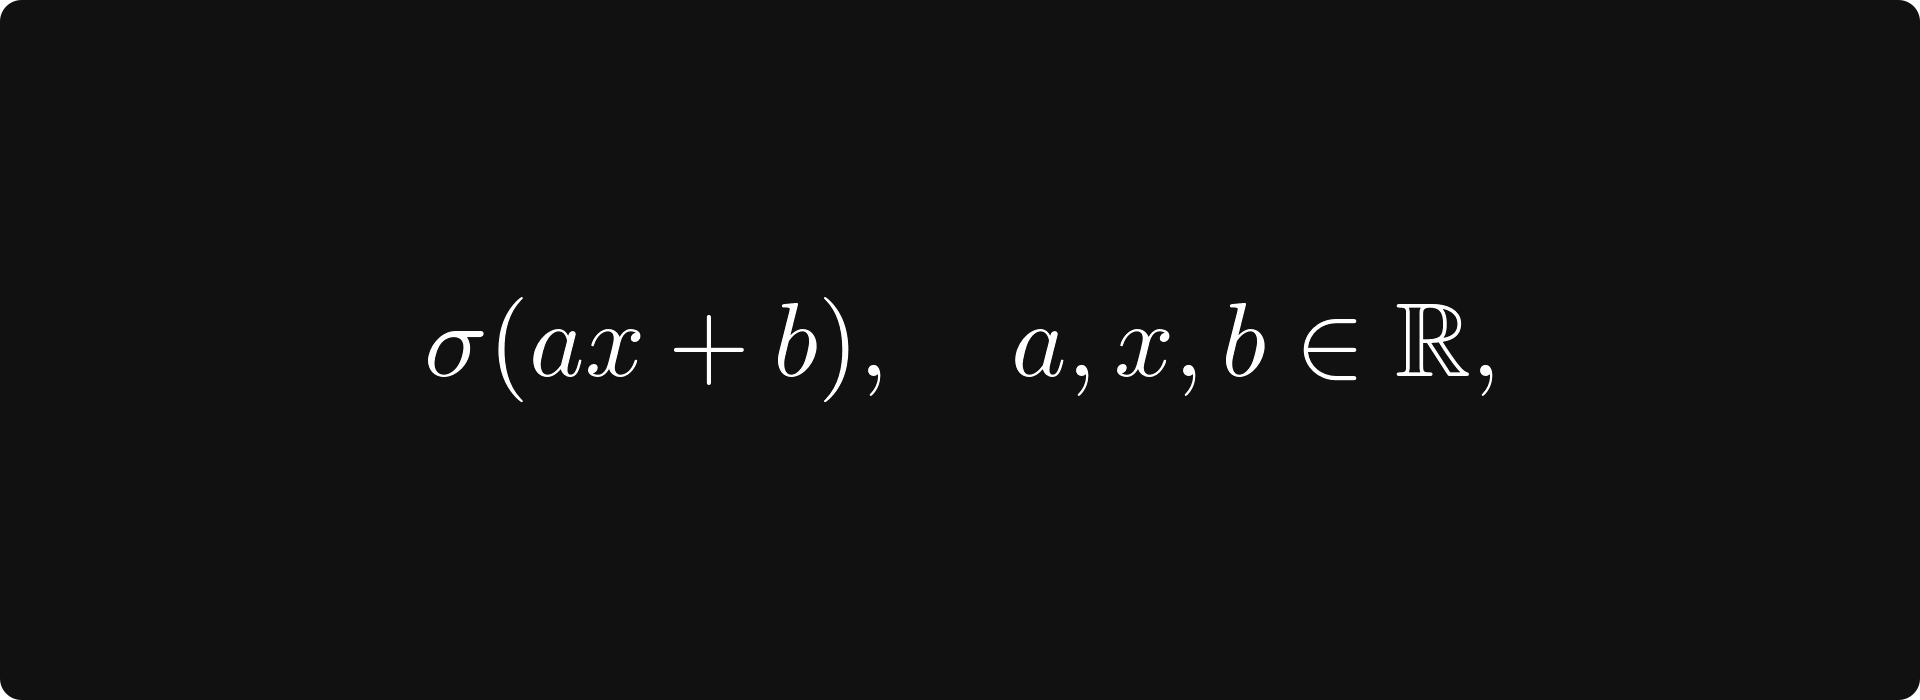
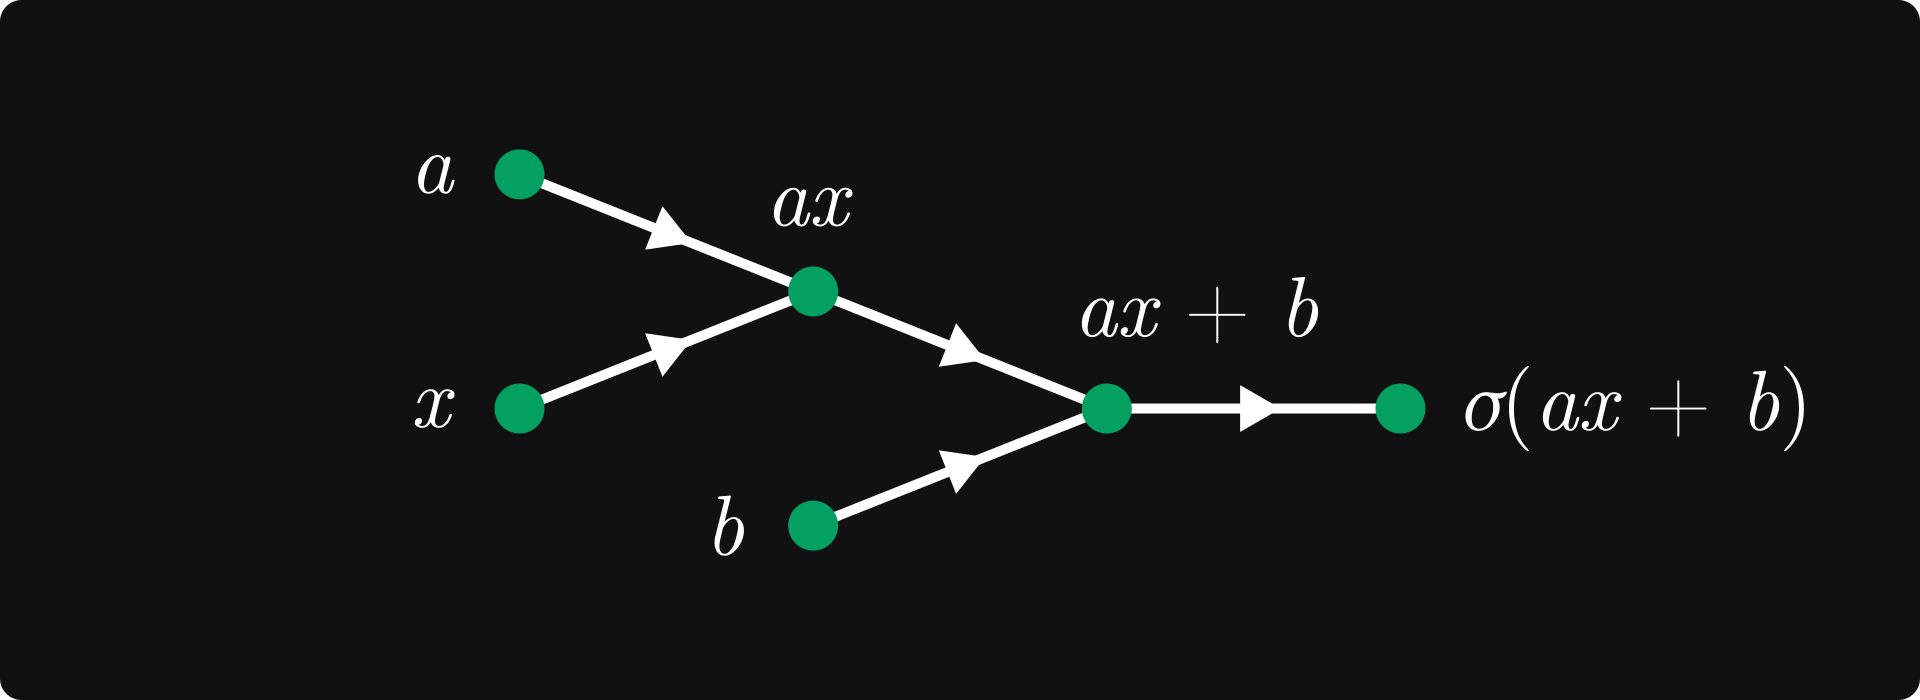
where σ(x) = (1 + e⁻ˣ)⁻¹ is the Sigmoid function. Computationally speaking, the expression sigmoid(a * x + b) is calculated in several steps:
c = a * x,d = a * x + b(which isd = c + b),and finally
e = sigmoid(a * x + b)(which ise = sigmoid(d)).
This can be represented via a graph, where
variables (such as
a,x,b,c = a * x, and so on) are the nodes,and computations between the variables (such as
*,+, and thesigmoidfunction) are the edges.
Something like this:
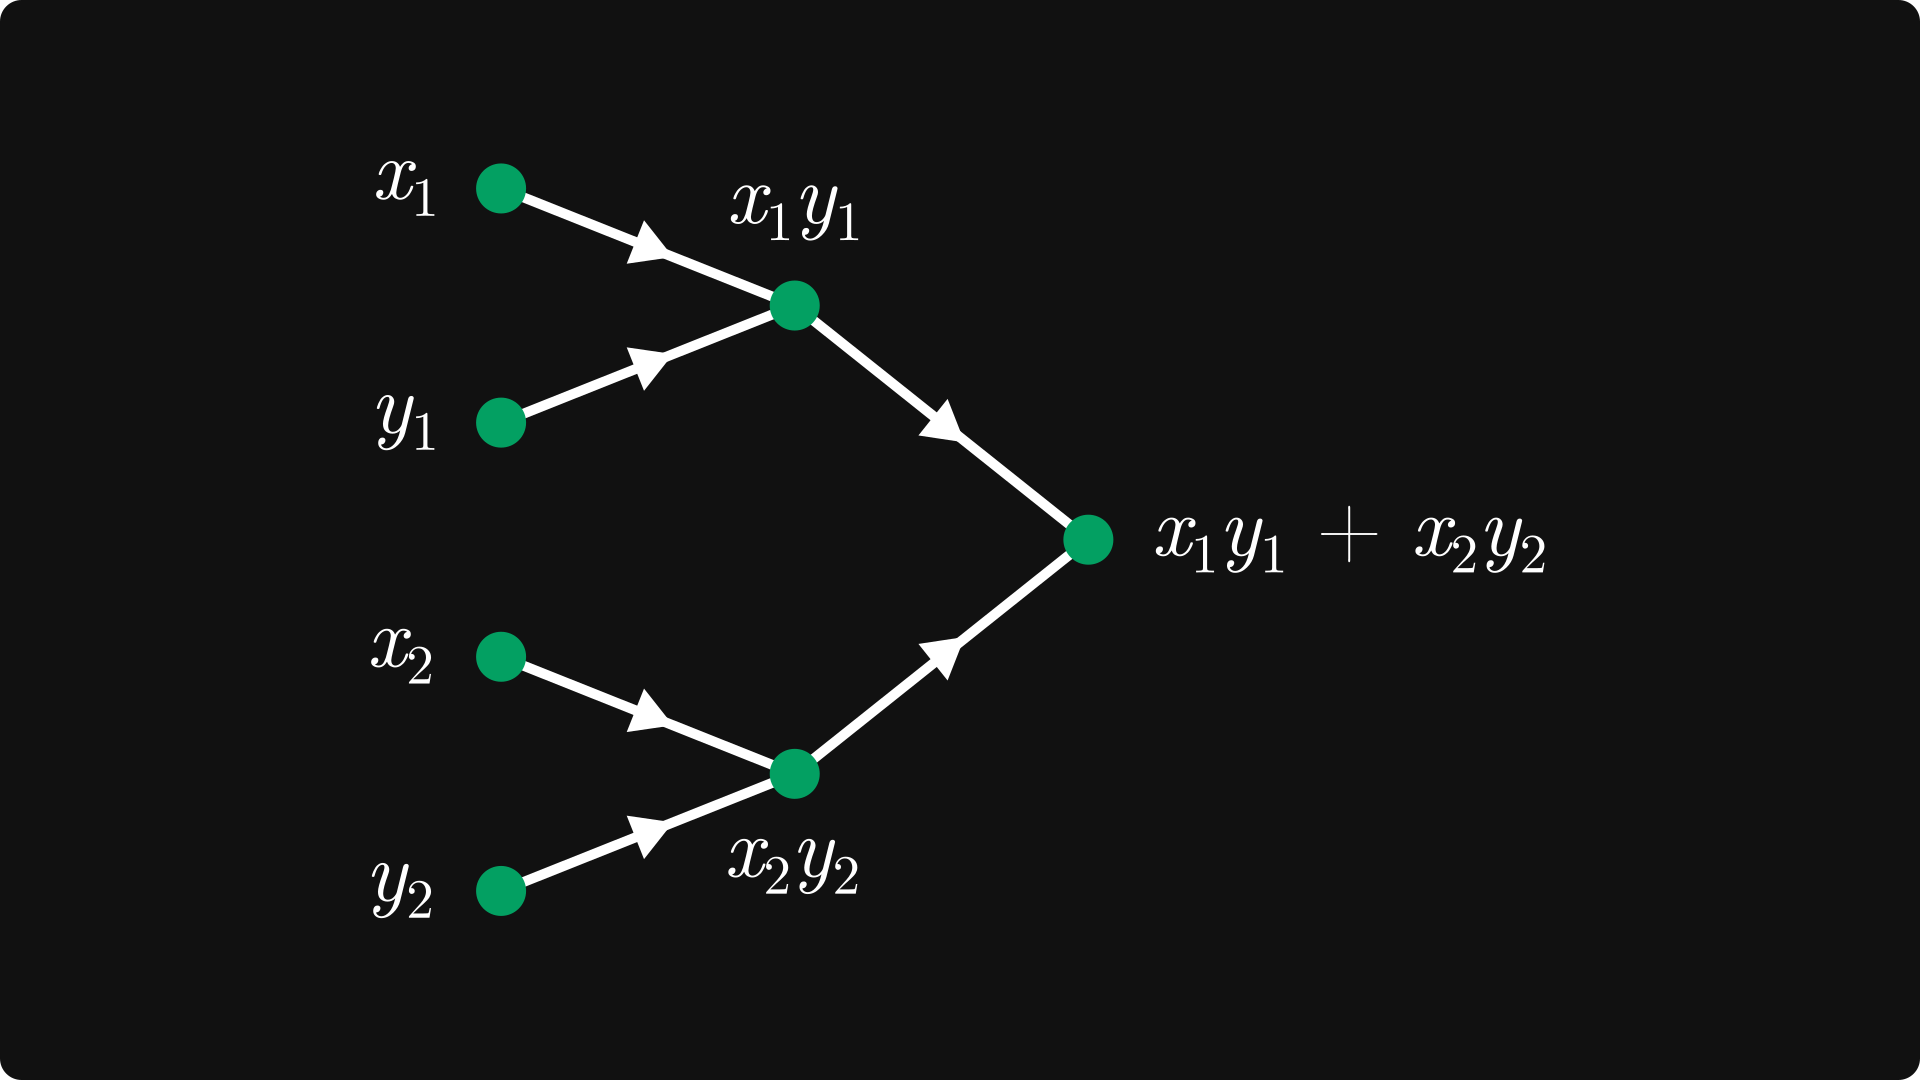
These are called computational graphs. Here’s another example: the dot product in two dimensions, defined by
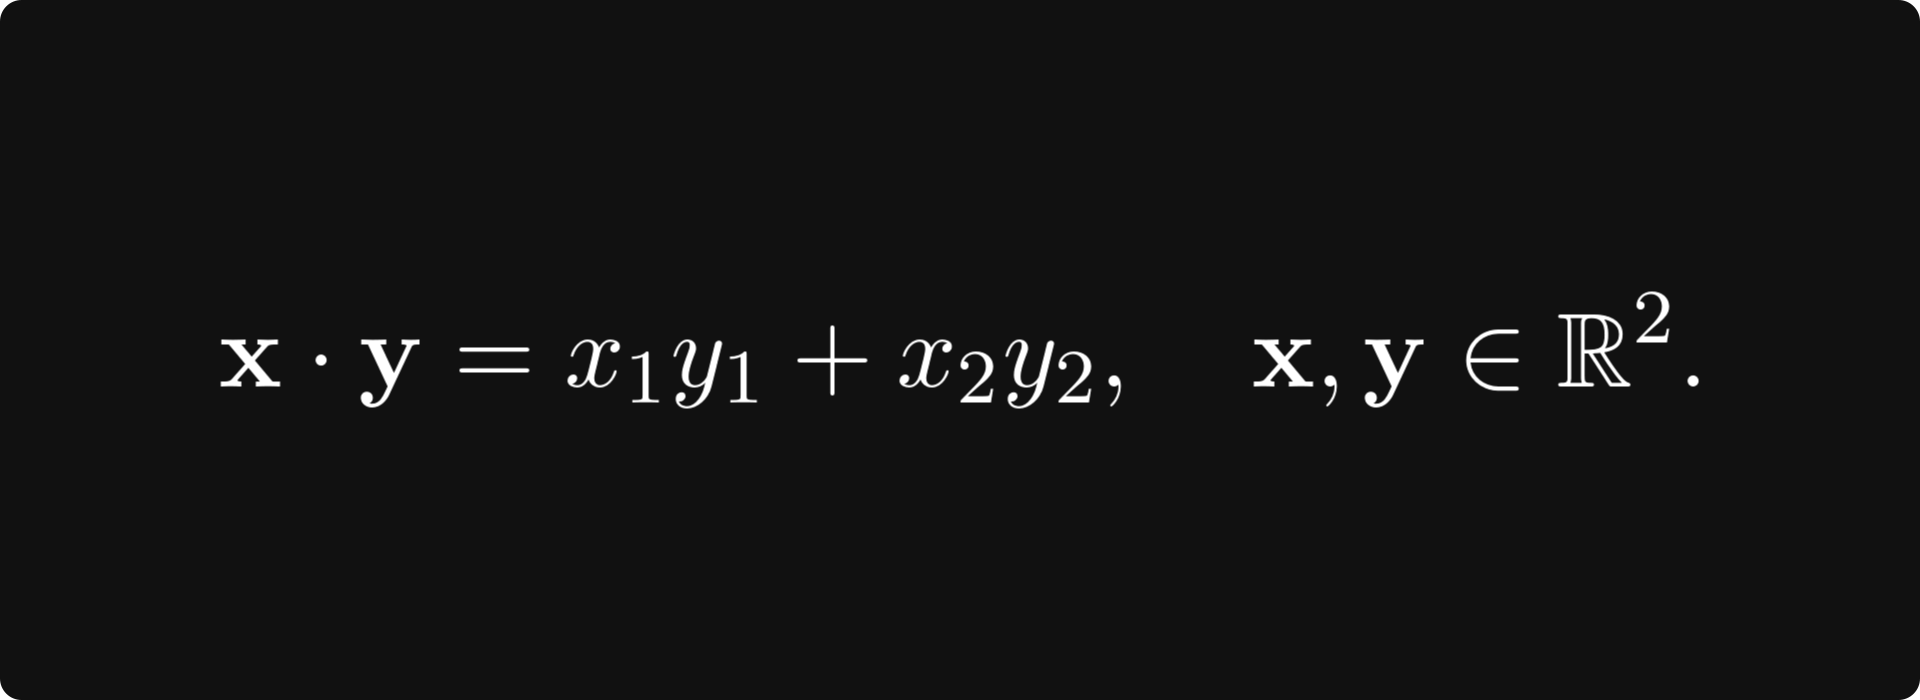
Let’s sketch this as well:
Why are we talking about computational graphs in a neural-networks-from-scratch course? Surely you’ve already seen an illustration like the following.
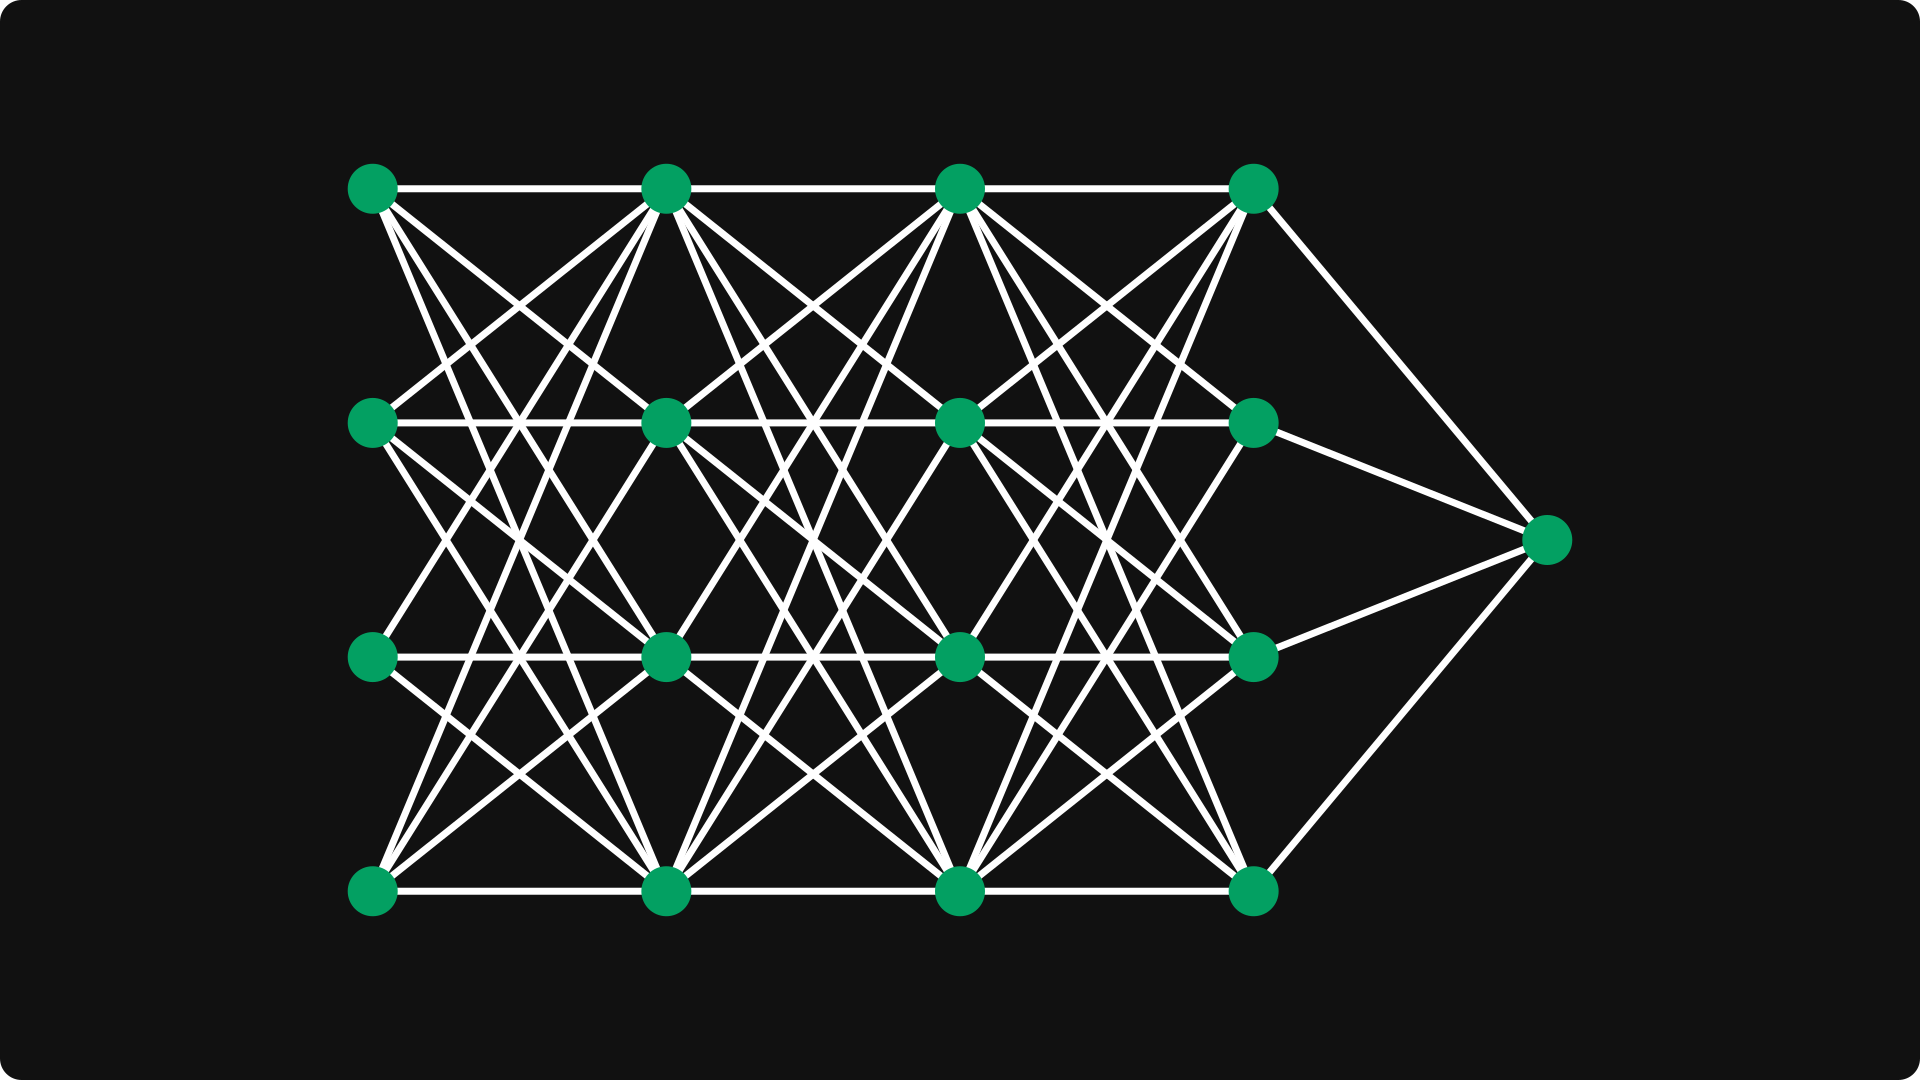
Neural networks are just complex mathematical expressions, which, in turn, can be represented by computational graphs.
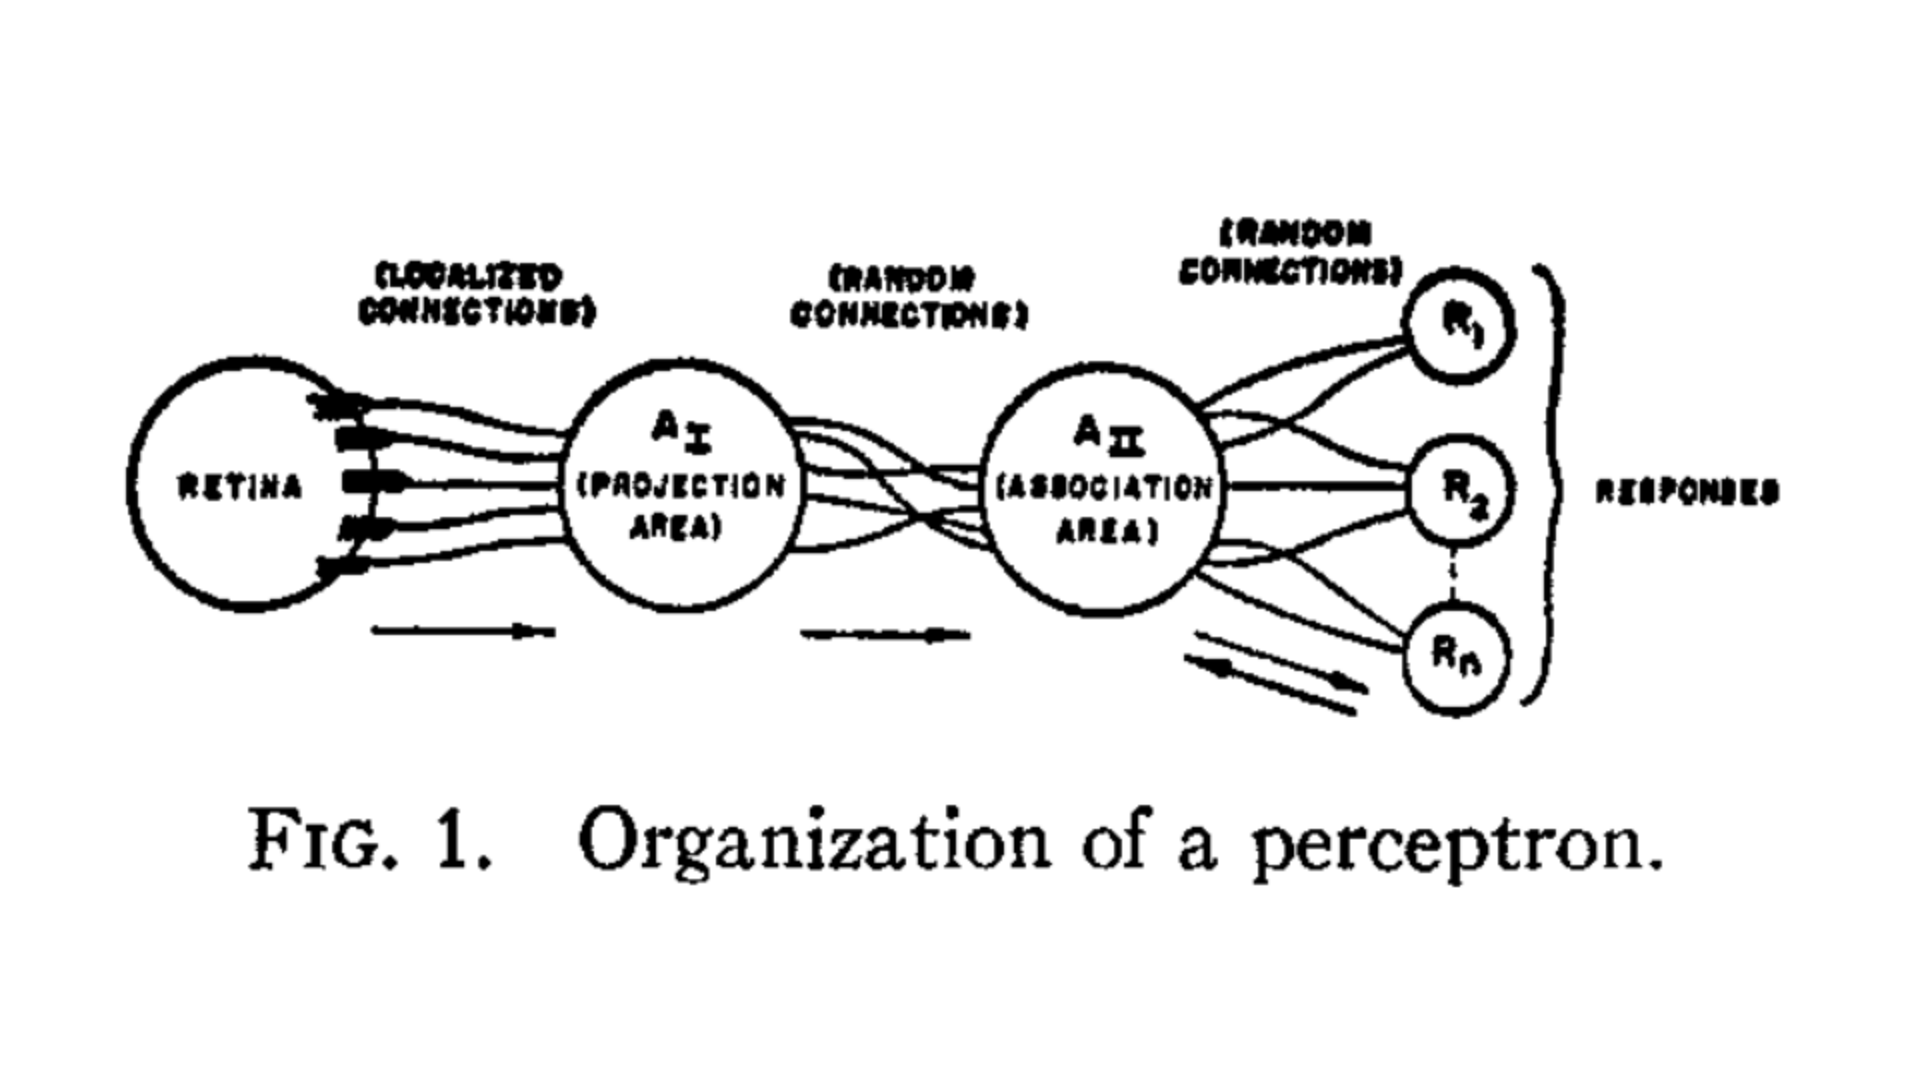
The nodes-and-edges structure has been present from the beginning: even the earliest pictorial representations of neural networks bore a striking resemblance to graphs. Mind you, we called them perceptrons back in the day. (We, as we, humans. I wasn’t alive back then, and probably neither were you.) Check out Fig. 1. from the original perceptron paper by Frank Rosenblatt.
The computational graph representation is not just a cute visualization tool; it allows for an efficient implementation of the gradient calculation via gradient descent. Spoiler alert: this is called backpropagation, which is one of the tools that enabled the training of enormous neural networks such as the later GPT models. We’ll talk about backpropagation in detail later, but for now, let’s get back on track.
We already know what a computational graph is. Now let’s implement one!
