Linear Regression and The Exploding Gradients
Even simple models can produce huge problems
Hi there! This post is from my upcoming Mathematics of Machine Learning book, available in early access.
New chapters are available for the premium subscribers of The Palindrome as well, but there are 40+ chapters (~500 pages) available exclusively for members of the early access.
Last time, we stopped right after implementing a functional multivariable regression model; at least, functional in theory. It performed adequately on toy datasets, so it’s time to test it on a real one.
We’ll whip out the famous California housing dataset that made an appearance in the last episode.
Let's not waste any time, and jump into the hardcore machine learning. (That is, calling the .fit method.)
These menacing warnings suggest that something went sideways.
What are the model parameters?
Damn. nan-s all over the place. This is the very first time we attempted to machine-learn a real dataset, and it all went wrong. Machine learning is hard.
What can be the issue? Those cursed nan-s rear their ugly head when numbers become too large, as in our case. Let's initialize a brand new model from scratch, and do the gradient descent one step at a time.
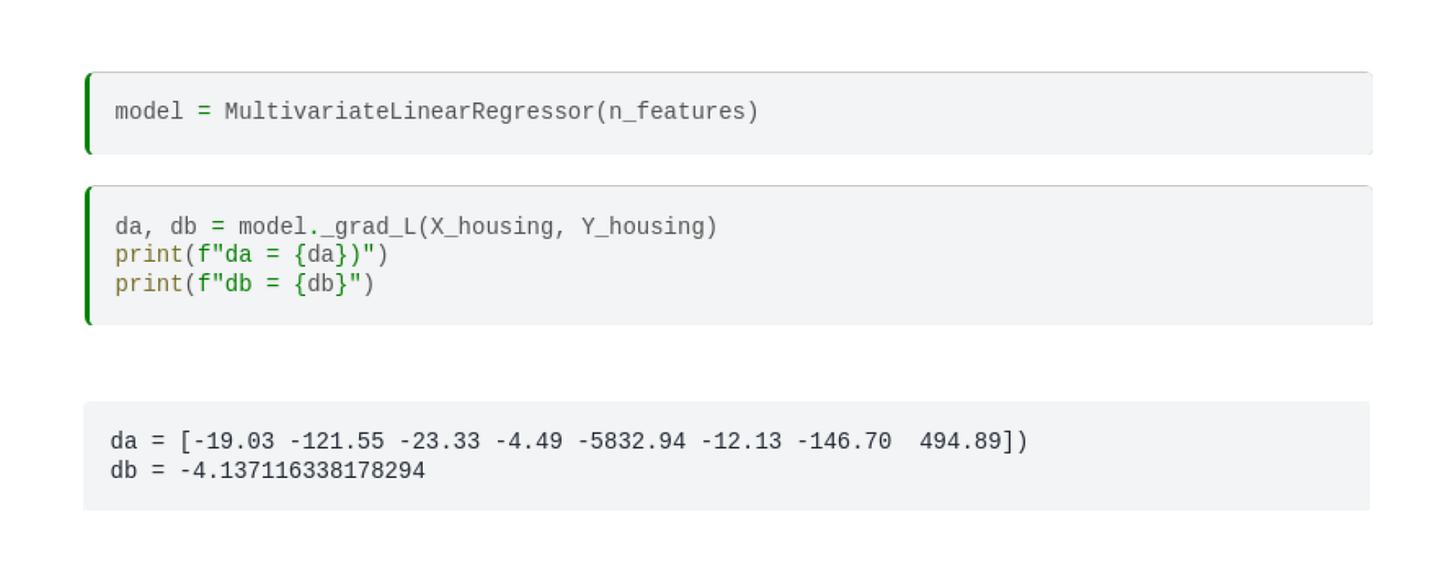
Here’s the weight gradient of a fresh model.
We can already see an issue at the fifth feature: the gradient is orders of magnitude larger there than elsewhere.
Let’s run a gradient descent for a single step and check the gradient. Here’s the weight gradient of a fresh model.
Things go crazy after just one step!
What can we do? The simplest idea is to lower the learning rate. After all, the learning rate is the multiplier of the gradient in the weight update equation. Let's try 0.000001, or 1e-6 in scientific notation!
Still nan. Let's shift the decimal to the right and see what happens if the learning rate is set to 1e-7!
Just one small step down in the learning rate, and instead of exploding, gradient descent got stuck at the start. Sure, we can try to find a value between `1e-6` and 1e-7, perhaps let the gradient descent run longer, but those won't solve our problem.
Let me show you the crux of the issue. Here are the first five rows of the data matrix.
The real problem is that the features are on a completely different scale. Check out the distribution of each feature, visualized on a barplot.
Uh-oh. The issue is glaring. What can we do?
For one, we can transform the features to roughly the same scale and then use the transformed dataset to train a model. Let's do that!


