
Visualizing the Chain Rule
(because I can never remember the formula)

The chain rule is one of the most important formulas of machine learning, allowing us to compute the gradient of composite functions. (Which is needed to do gradient descent and fit the model to the data.)
In a single variable, the chain rule says that
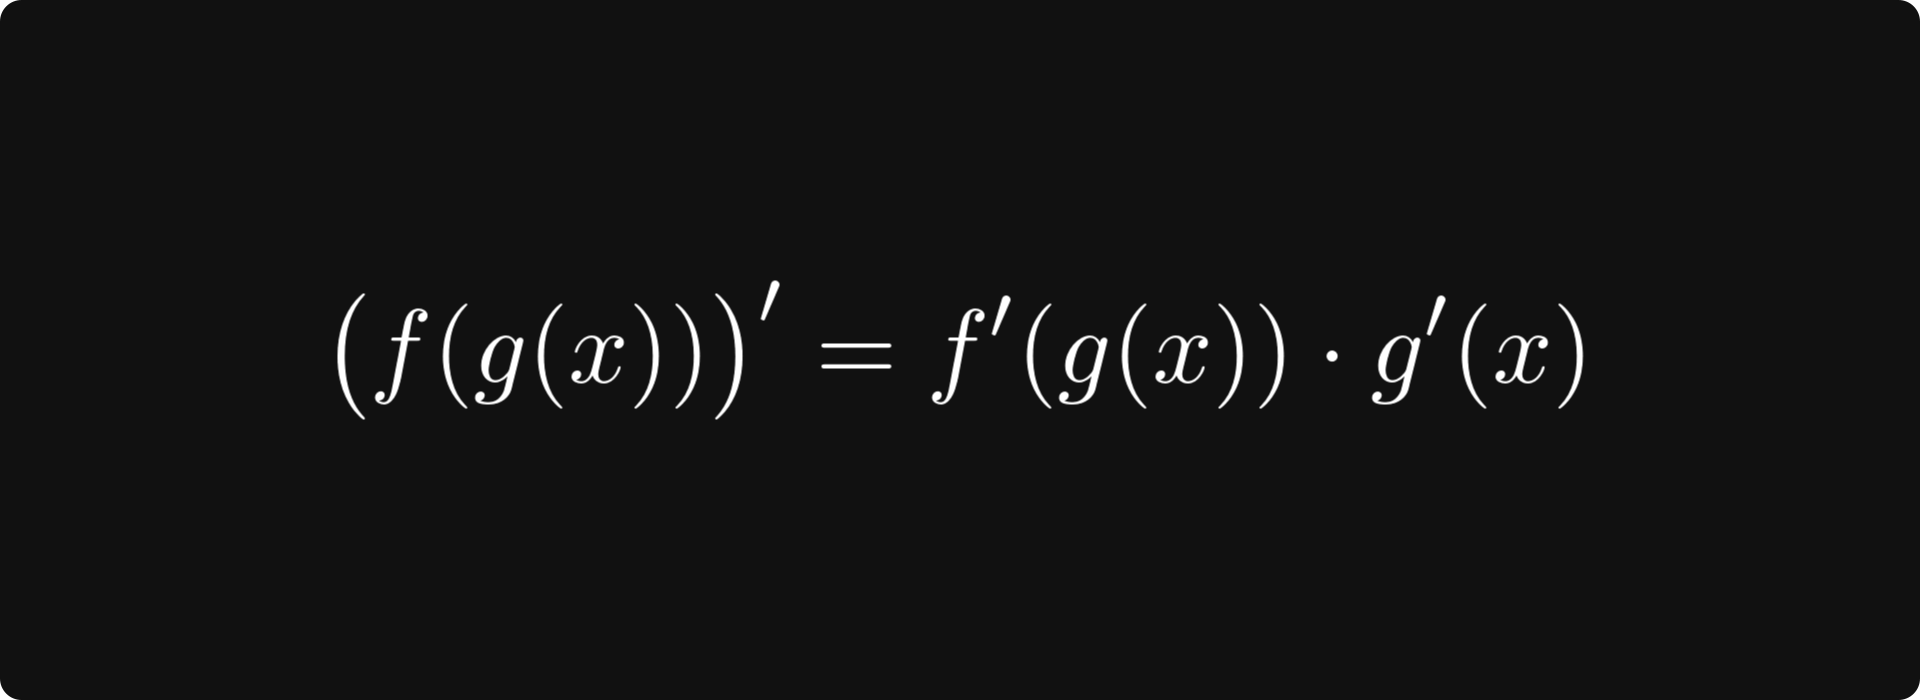
holds for any two univariate differentiable functions f and g. It’s simple, compact, and user-friendly.
However, the math quickly becomes complicated when we introduce multiple variables. And we have to, because there are billions of parameters to tune.
In the general case, we are interested in the composition of the vector-vector function g: ℝⁿ → ℝᵐ with the vector-scalar function f: ℝᵐ → ℝ. For instance, if we have
a machine learning model with n parameters x = (x₁, ..., xₙ),
a training dataset of m samples d₁, ..., dₘ,
predictions g(x) = (g₁(x, d₁), ..., gₘ(w, dₘ)),
and a loss function f,
then fitting the model is equivalent to finding the maximum of the composite function h(x) = f(g(x)). (The dependence on the data in g(x) is omitted for simplicity.)
To compute the gradient, that is,
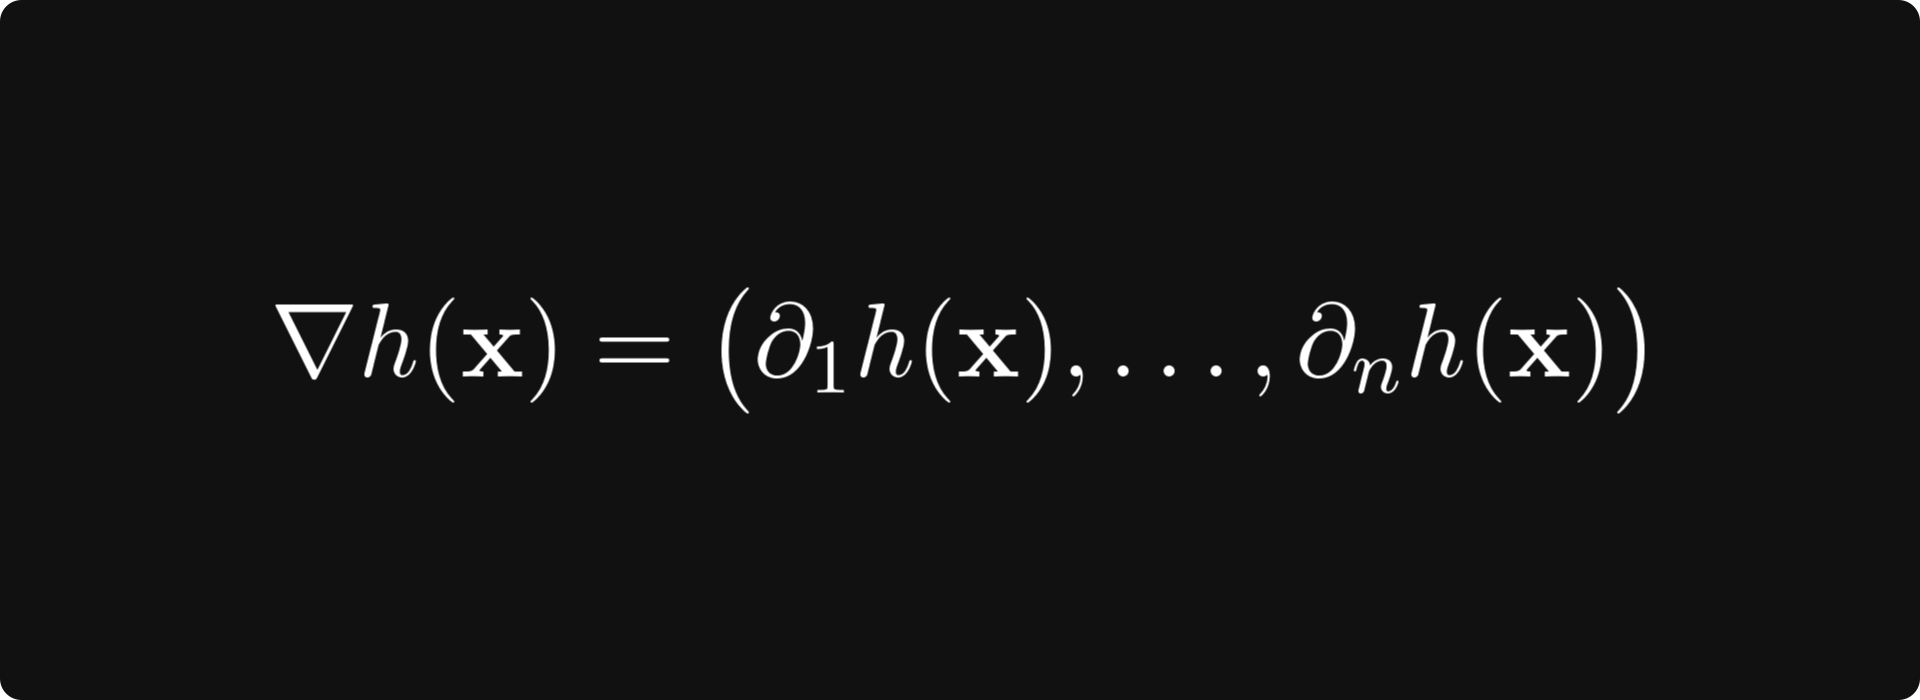
(where ∂ᵢh denotes the partial derivative of the function h with respect to its i-th variable), the chain rule says that
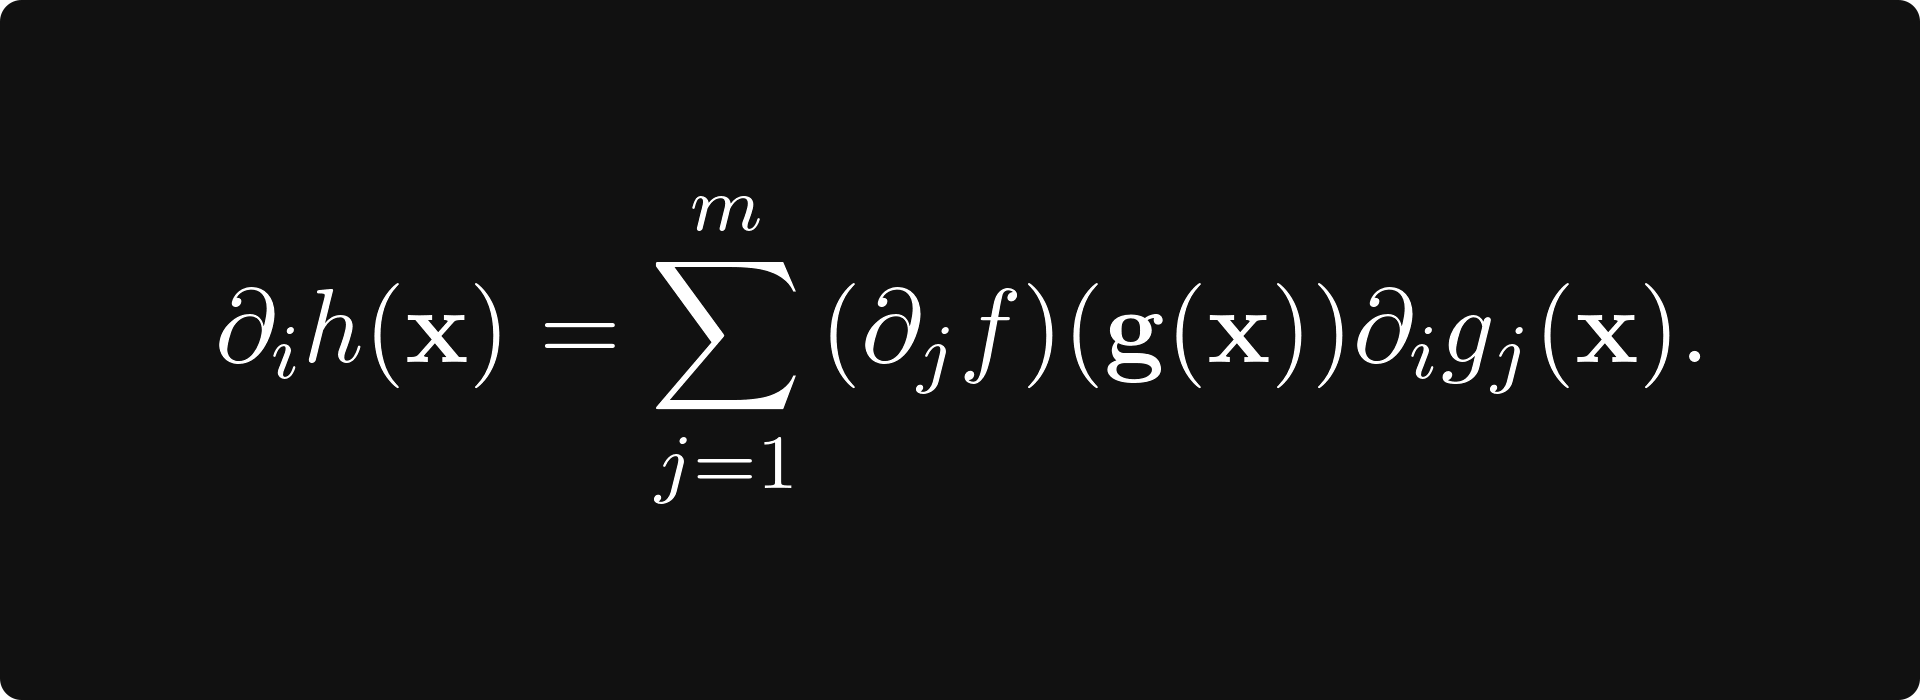
This post is about what’s behind this formula.
