Hey! It’s Tivadar from The Palindrome.
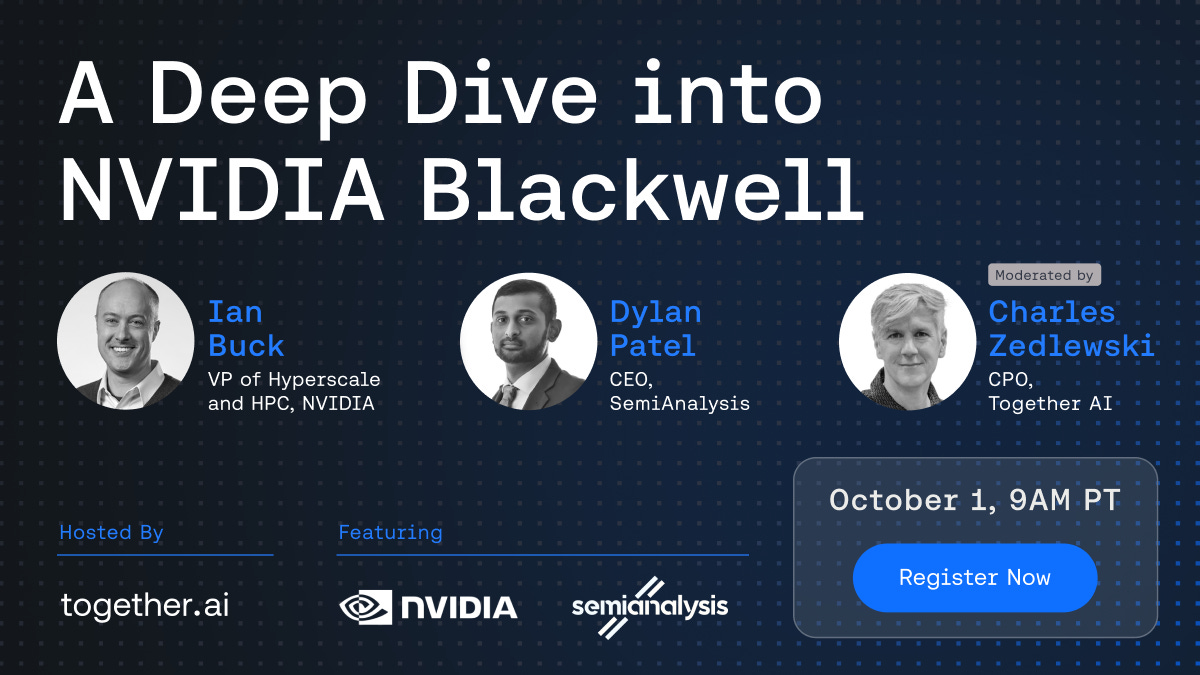
Today’s issue is sponsored by Together AI, a GPU cloud and model platform provider. They are hosting a discussion between Dylan Patel (SemiAnalysis) and Ian Buck (NVIDIA) for an insider look at NVIDIA Blackwell, the latest microarchitecture behind the GPUs that power our neural networks.
The deep dive will cover architecture, optimizations, implementation, and more, along with an opportunity to get your questions answered.
Join us on Wednesday, October 1 at 9 AM PDT!
Two of the most common misconceptions I hear:
“Machine learning is just applied statistics.”
“Statistics is just applied probability.”
Like all proper misconceptions, these are rooted in truth as well. Machine learning heavily utilizes statistics, and statistics is built upon probability theory.
However, there are fundamental differences in the mindsets.
Probability enables us to reason about uncertainty; statistics quantifies and explains it. Machine learning makes predictions from data. It might use probability and statistics. It might not.
This post is about the differences, the similarities, and everything in between. Because these classes are definitely not linearly separable.
One thing is sure: probability is where it all starts.
📌 The Palindrome breaks down advanced math and machine learning concepts with visuals that make everything click.
Join the premium tier to get access to the upcoming live courses on Neural Networks from Scratch and Mathematics of Machine Learning.
Probability
Once upon a time, Newton invented calculus. An apple fell on his head, and soon, he had a method to compute the trajectory of said apple. Or a thrown rock. Or an orbiting space station.
However, compared to an orbiting space station, predicting the outcome of a tossed coin is extremely hard. Think about it: a space station orbits in vacuum, but the coin is flying in the air. From a physical perspective, vacuum is a much simpler ambience. No complex hydrodynamical forces, no turbulence, no chaos.
Nowadays, we can precisely compute the trajectory of a falling coin, but this was not the case in the 18th century, when probability theory came to life. Mind you, it was started by a few aristocrats looking for an edge in their gambling adventures.
Antoine Gombaud, chevalier de Méré wanted to play a game, but he accidentally launched an investigation that gave birth to one of the most essential tools. One that became the logic of science.
Think of probability as a means of dealing with missing information. Probability theory provides the tools to formulate and deal with such models. To illustrate this principle, let’s see the simplest possible example, one that we already talked about: tossing a coin.
Let’s build a probabilistic model! What makes one? Probability is a measure of likelihood for the so-called events. In our case, the events are the potential outcomes, i.e. heads or tails.
That is, the event space is modeled by a set, and the events by subsets of the event space.
There are three simple rules that any measure of probability must satisfy:
the probability is a nonnegative number between 0 and 1,
the probability of Ω is 1,
and the probability of mutually exclusive events sum up.
These are called Kolmogorov’s axioms.
Because the outcome of a coin toss is perfectly random, it is safe to assume that the probability of heads and tails is the same. With this, our probabilistic model is complete.
Probability theory allows us to reason within the confines of this model. What is the probability of getting five heads after tossing it up ten times?
(If you are interested in more about probability and why it is the logic of science, check out the very first post of this newsletter.)
However, assigning probabilities to our probabilistic models is a different question. How do we solve that?
Enter the world of statistics.
Statistics
We might reason our way to a probability model in cases such as coin tossing and dice rolling, but we are rarely that lucky. For instance, let’s pick a random person in a classroom. What is the probability that they are taller than 1.50 m? (Or 4.921 ft, if you use the imperial metric system.)
To find that, we have to perform statistics.
The simplest way to do that is to enumerate the class, count how many students are above 1.50 m, then divide it by the total number of students.
But again, we might not be that lucky. The question might be: what is the probability that a random person from planet Earth is taller than 1.50 m?
As we cannot line up the entire humanity in ascending order, we have to perform a statistical estimation. For one, we can assume that the height of humans follows a Gaussian distribution, whose parameters we estimate via sampling.
Mathematically speaking, this is our process.
Assume that the height follows a Gaussian distribution with mean μ and variance σ².
Pick a random sample of people and measure their heights.
Estimate μ and σ² using our sample.
Approximate the probability of “being taller than 1.50 m” using the estimated Gaussian distribution.
This is statistics. We model, sample, measure, then fit. Almost like a tailor, only with probability distributions instead of a sheet of textile.
Statistical methods excel in providing qualitative and quantitative explanations from our observations. For instance,
“are men really taller than women?”,
“is this vaccine really effective, or are we only observing a random effect?”,
“how long is the expected lifetime of this lightbulb?”,
or “how many passengers miss their flight on average?”.
All of these require a deep knowledge of our data, and this is what statistics brings to the table. Insight. Explanation. Interpretation.
To sum up: probability enables us to reason about uncertainty; statistics quantifies and explains it.
So, what is machine learning, then?
Machine learning
Let’s continue with the previous example: people and their heights.
Even though we (seem to) understand the distribution of body height, we are still not there.
What if we have to guess a person’s height given their age, weight, and other biometric data? Say, we have a huge table of such data, but some of the height values are missing. So, we have to guess.
Luckily, we have a bunch of rows complete with height data. This is our training data.
Instead of just a probability model, we are looking for a prediction. A function that takes in a set of features, and outputs a single number: a height estimate.
There are several ways to achieve this. We might use the method of least squares to fit a linear function, or we might fit a mixture of Gaussian distributions and pick the most likely height for each feature vector. The latter method uses statistics, the other does not.
This is machine learning. There are two key components:
a well-defined input and output,
and a parametric model.
Machine learning problems come in dozens of flavors. For instance, “Is there a cat in this picture?”, “What will the price of this stock be tomorrow?”, or “What is the vector representation of this sentence?” are all well-suited for machine learning.
Note that ML is not the only solution for these tasks. One can hand-craft an image classifier with manually designed features; or a stock price predictor using a mathematical modeling approach. However, with the exponential boom of available data, machine learning methods far outperform classical ones.
Summary
Probability theory. Statistics. Machine learning. The interactions between these fields are so rich that they are easy to conflate with each other. However, there are vast differences.
To sum up, probability theory provides a mathematical framework to reason about uncertainty. It defines the notion of events, probabilities, and it answers questions like
Are the events independent?
Will observing one event change the probability of another one?
What is the average value of my observations?
On the other hand, statistics quantifies uncertainty, enabling us to build probabilistic models and gain insight from data. We can use it to answer questions like
What is the underlying probability distribution behind our data?
Are my two sets of data samples really different, or was I just unlucky with my experiments?
How confident can I be in my data-driven decision?
Parallel to all of this, machine learning aims to learn predictive models from data. These models are not necessarily probabilistic. Machine learning tasks are defined by the inputs and outputs, and the type of training data. Some examples are:
input: an image, output: the item on the image (classification),
input: a list of vectors, output: a list of class labels (unsupervised clustering),
input: a list of vectors, output: a list of vectors (dimensionality reduction, embedding),
input: a vector of features, output: a number (regression),
and many more.
If you would like to read more about the differences between probability theory, statistics, and machine learning, I recommend the book Modeling Mindsets by Christoph Molnar. (He is also the author of the Mindful Modeler, one of my favorite newsletters here.)
Great post, Tivadar! Very clear and succinct.
In some cases, the exact same analysis is used in statistics and machine learning but the results are used differently. For example, a statistician might use a regression to make inferences about a population parameter, whereas a machine learning engineer could use the same analysis and the same data to make a prediction about a new data value.